Requirements
Here, you’ll find more information on suggested equipment and data input requirements. The details about the model can be found on the More page. Detailed information about the code and how to use it is in the GitHub repository.
ECG Equipment
Common equipment requirements
- The recording should be of ECG Lead I (limb lead across the heart). See ECG Lead I below for more details.
- The sampling rate should be a minimum of 125 Hz. Higher is better, with the “optimal” rate for the network’s input being 256 Hz.
- The sampling resolution should be a minimum of 16 bits. Higher is better.
Clinical equipment
If you are using clinical or research equipment to record ECG, you’ll just need to make sure that it meets the common equipment requirements above.
Consumer equipment
Unfortunately, there are few commercial ECG recording devices on the market right now. I am only aware of two devices that record ECG Lead I and could be worn comfortably while asleep. However, I have not personally tried either yet, so I cannot vouch for them. (Blog update: I’ve begun testing them.)
- Movesense
- The sampling rates are 125, 128, 200, 250, 256, 500, and 512 Hz.
- Polar H10
- The sampling rate is 130 Hz.
ECG Lead I
Basics
The input that is required for the model is ECG Lead I (limb lead across the heart). There is a helpful diagram here: ECG Lead positioning, for the proper locations of the right arm (RA) and left arm (LA) electrodes.
Why ECG Lead I? They all look the same to me
The answer to “Why did you use ECG Lead I?” is straightforward: most professionally scored sleep datasets I had access to only included ECG Lead I recordings (see the paper for details). Using a different lead—or multiple leads—would have drastically reduced the size of the training and testing data. Consequently, this would’ve reduced the performance and generalizability of the model.
On a similar note, I’ve been asked several times, “Can I use a different lead?” or “Can I ‘convert’ my ECG data into the correct lead?” The short answer is: No, you cannot. Neither substitution nor conversion is possible. Here’s why:
-
The model’s training and testing assumptions
The model was trained and tested exclusively on ECG Lead I data. It hasn’t seen data from other leads, so there’s no reason to expect it to generalize to them. Claims in the paper about performance equivalence to PSG only apply if all the outlined data assumptions are met—including the use of ECG Lead I.
-
HRV misconception
Some people have assumed the model is doing a convoluted conversion from ECG to RR intervals (heartbeat timing) to extract the Heart Rate Variability (HRV). That’s not the case. As I detailed in the paper, HRV-based models have long plateaued in performance and perform significantly worse than clinical PSG scoring. Furthermore, this model extracts far more information from the ECG.
-
The nature of ECG data
While electrode pairs may look similar, each lead measures a distinct “view” of the heart’s electrical activity. These views differ because of how action potentials interact—some cancel, others add. Imagine two voltages summing to zero; you lose any information about the individual inputs. This is why cardiologists use 12-lead ECGs: no single lead tells the whole story.
Moreover, ECG records time-varying electrical dynamics, unique to each heart at each moment. Unlike reconstructing a static 3D model, there’s no way to infer the dynamics of one lead from another, especially for real-time scoring of individual sleep.
Though it would be fascinating to develop a lead-conversion algorithm, it isn’t theoretically possible to reconstruct the unique, time-sensitive heart dynamics from a different lead. And it are those unique time-varying dynamics that are essential to sleep staging using ECG.
Input Processing
If you are processing data using your own pipeline, you need to make sure that the final output (the input ECG for the network) matches the expectations listed in the paper. Specifically, the network expects the following steps to occur, in this order:
- Filter the noise:
- High-pass filter at 0.5 Hz to remove baseline wander.
- Use notch filters to remove line noise (50/60 Hz) and any other constant-frequency noises.
- If necessary, resampled to 256 Hz (resample after filtering).
- Scale the data in the following manner:
- The median of the entire recording should be subtracted (such that the median = 0).
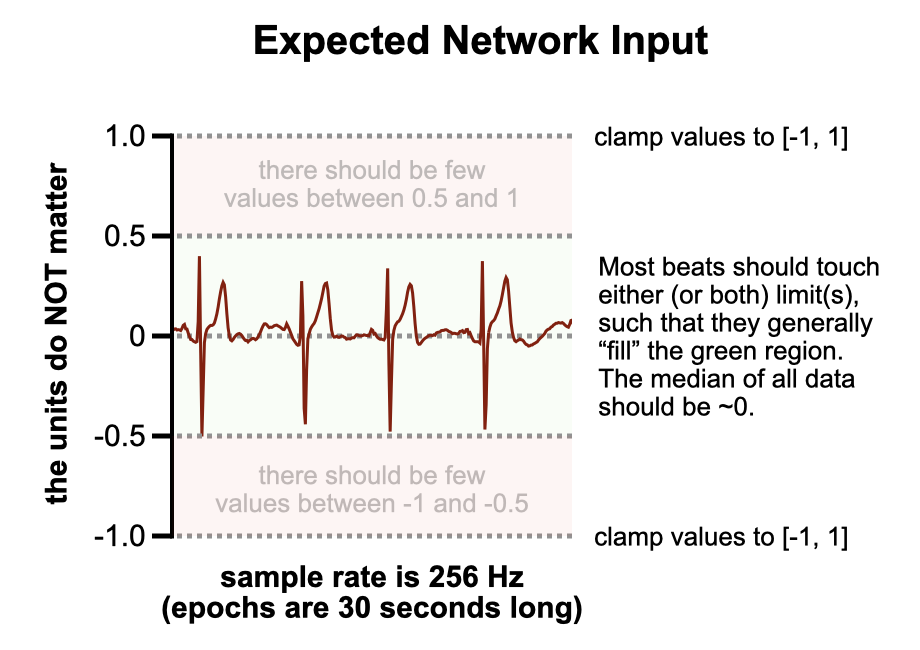
- Measure the min and max values for every heartbeat (NOT all data, just the heartbeats), then scale the data such that the 90th percentile (or greater) of the min and max lies within the range [-0.5, 0.5].
- Movement artifacts and other noise may exceed the amplitude of most heartbeats, and it is okay if those values lie within the range of [-1, -0.5] and [0.5, 1].
- Regardless of abnormally “tall” heartbeats or noise, all values should be clamped to [-1, 1].
- Finally, divide/reshape the data into 30-second epochs (shape: epoch_count x 7680).
To repeat, if you do not use the correct pipeline to prepare your data, I make no claims about the network’s ability to score sleep on your data correctly.
When loading data, the network’s code will test, by default, if any values are outside [-1, 1] and if the median ~= 0. However, it will not know if the ECG is scaled inappropriately (such as heartbeats being too large or too small).
Target example
The figure below should help clarify the ECG requirements. When the data is appropriately scaled, any random segment of it should resemble the example shown. The isoelectric line should always be roughly at a value of 0. Typically, the R wave—often the tallest spike in the middle of each heartbeat—should either touch or fall just below the 0.5 value. If another wave is taller (the T wave is the second-most common), then likewise it should either touch or fall just below the 0.5 value.

Scaling tolerance
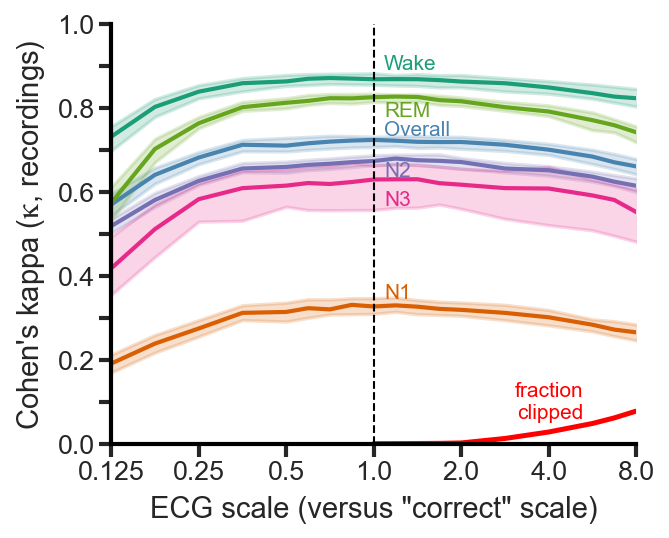
After running extensive tests recently, I found that the network is robust to scaling from 0.5x to 2.0x of the “correct” scale (using the full pipeline that was used in the paper, and is in the repository). As long as your scaling is roughly as I describe above (and you did all of the other filtering correctly before that), you can be confident that the results will be nearly identical.

Median subtraction
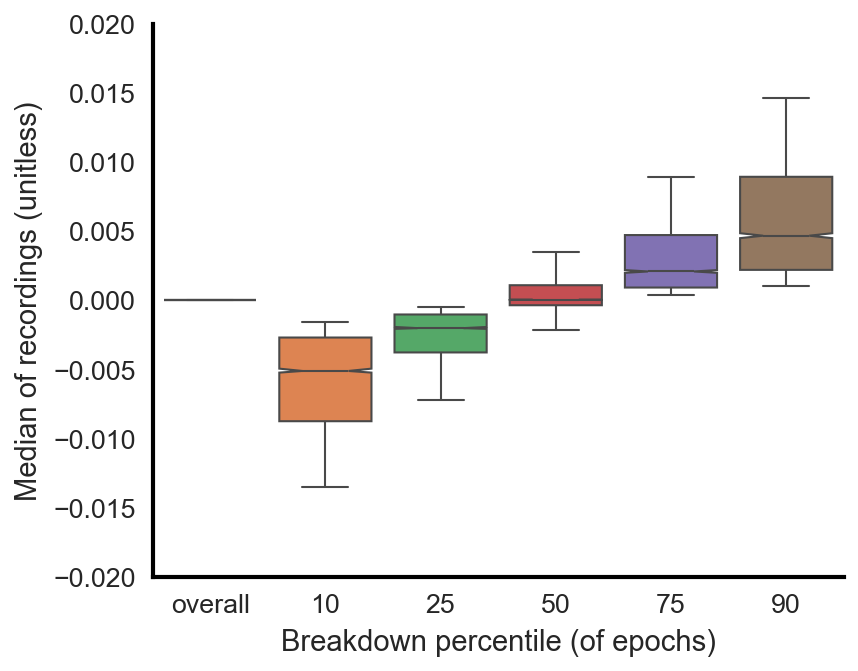
While the median of the entire recording should be subtracted, such that the median for the entire recording is ~0, individual epochs could have medians that slightly deviate from this. This is okay and expected. Although the data will be high-pass filtered (described above), there will still be some minimal amount of baseline wander. The figure below shows that for all 4,000 recordings used (training, validation, testing), the overall median is indeed 0 for all recordings. However, if you look at the 10th percentile median value of all epochs across all recordings, for instance, you find that the value is ever so slightly below zero. And this increases as one goes from the 10th percentile towards the 90th percentile.
